The moment I thought, "Once I attach OCR, it will be done," is when the real problem-solving began.
To pre-validate the pipeline for structuring unstructured documents, I chose a math problem PDF as a test case. This was suitable data for simultaneously verifying layout analysis and semantic mapping because the problem areas and numbers are clearly distinguished, yet the layout features a mix of single-column and double-column formats.
However, the actual data was much more complex than expected. The question numbers and texts were tightly packed in pixel units, and the layout structure varied from page to page. Ultimately, it was quickly confirmed that simple OCR alone could not reliably restore the structure of the questions.
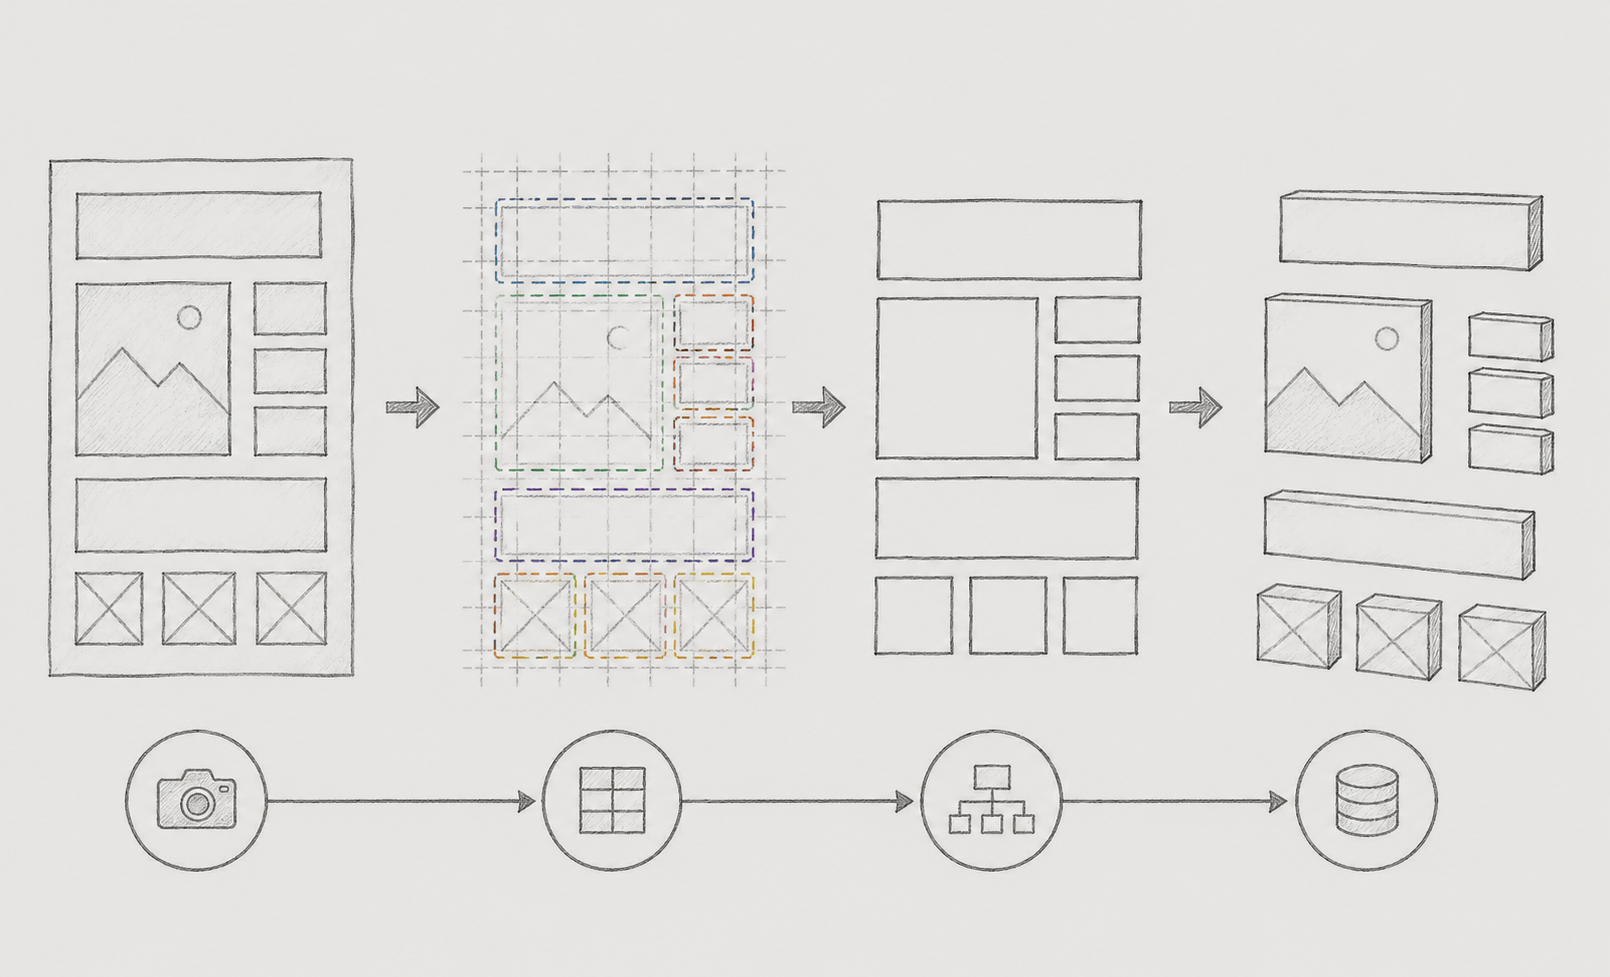
In this article, I have organized the process of designing a 4-stage pipeline consisting of Vision detection → coordinate alignment → mapping → OCR to solve these problems, iterating and improving through failures.
1. Background of Technology Selection - Why Vision Detection Had to Come First
In the process of structuring the math problem PDF, we initially chose to apply OCR first. At the time, I believed that if the recognition rate of OCR was high enough, the structure of the questions would naturally be restored.
However, in the actual test, completely different issues arose. Especially in documents mixed with a two-column layout, the OCR failed to recognize the document in the order that a person would read it. The order of questions in the left and right columns was mixed up, and there were repeated instances where question numbers were incorrectly recognized as part of the main text.
For example, in the OCR results, question 3 appeared after question 12, or there were cases where question numbers were misinterpreted as part of a formula.
Ultimately, what I felt was that OCR is a "text-reading technology" and not a "document structure understanding technology." In other words, if the document structure is not reliably organized first, the OCR recognition rate, no matter how high, could not be used directly in the actual results.
Subsequently, I completely changed my approach. First, I redesigned the pipeline so that the document structure itself is detected first, and OCR only plays the role of reading the text within each area.
In particular, we prioritized the following criteria.
-
Whether the layout is single-column or double-column, the order of the items will be reliably restored.
-
Even if some OCR failures occur, the overall batch flow will not be interrupted
-
It will be a structure that can be extended to other domains such as future web UI layout analysis
As a result, we shifted from an OCR-centric approach to a vision-based structural analysis approach.
2. Applied architecture and implementation process
The entire pipeline is designed to be split into four major stages. The most important aspect was to reduce the coupling between each stage. We aimed to maintain an independent structure so that even if a specific module is replaced or modified, the overall flow would be minimally affected.
Additionally, it was designed to allow step-by-step testing, enabling quick tracking of which stage the error occurred in when a problem arises.
2.1 Data Construction and YOLOv8 Training
We chose Ultralytics' YOLOv8 as the object detection model. It has a structure that can secure sufficient mAP even in real-time inference, and it allows us to leverage the Ultralytics ecosystem to relatively quickly establish the model training, inference, and validation workflow.
The class was defined with two boxes: the problem box (question area) and the number box (number area). The two areas have distinctly different semantic units, and separation learning was essential in order to map them 1:1 in the subsequent mapping phase. From now on, we will refer to the two areas as the problem box and the number box, respectively.
However, the part that took the most time in the actual project was not the model itself but the organization of labeling rules. It was necessary to clearly separate the problem area and the number area, and when the boundaries overlapped, labeling had to be done consistently using the same criteria.
In the actual learning process, the phenomenon of the model learning in unintended directions occurred repeatedly, even with slight variations in the labeling criteria. For example, when one dataset included item numbers and broadly captured the boxes, while another dataset tightly captured only the numbers, the model failed to learn consistent features.
Ultimately, it was reaffirmed that "consistent data definitions" are more important than model performance.
2.2 OCR Preprocessing - 2x Upscaling and Binarization
After the vision detection was completed and the number boxes were cropped, preprocessing was done to ensure that OCR could reliably read the numbers. Initially, the original resolution was passed to Tesseract, but the recognition rate of the small item numbers was lower than expected.
I attempted to apply a method that upscales the cropped area to the nearest integer multiple, followed by grayscale conversion and binarization (Otsu). When comparing with multiples of 2x, 3x, etc., the 2x was the most stable for the domain data.
Increasing the multiple further actually made recognition unstable. Even with the interpolation algorithm fixed to nearest, pixel-level noise was enlarged, and it was judged that this contradicted Tesseract's internal normalization assumptions, causing the outlines of small numbers to become blurred instead.
We also configured the Page Segmentation Mode (PSM) to not be fixed to a single value, but to attempt single block (PSM 6) first, and then retry with a single line (PSM 7) in case of failure. This was due to the number box having a short character count of 1-3, which caused significant variations in results depending on the PSM.
The most important lesson learned from this process was that "the input data characteristics and the model and engine settings need to be consistently aligned to achieve actual performance improvement." Simply increasing the resolution or changing the mode did not lead to higher recognition rates.
2.3 Coordinate-based Layout Restoration and Matching Score Design
Implemented a coordinate sorting logic to restore the actual document reading order based on the detected boxes. First, the problem boxes were separated into left and right columns based on the mid-value of the x-axis of the page width (image_width × 0.5). Then, within each column, they were sorted in the order of y-axis → x-axis to create a sequence similar to the actual reading flow of a person.
Through this process, I was able to relatively stably restore the order of questions in documents that mixed 1st and 2nd layouts.
Subsequently, the connection between the problem box and the number box used normalized scoring weights that reflect domain characteristics instead of simple Euclidean distance. In the math problem layout, the characteristic is that the question numbers are attached at almost the same distance to the top left of the text, making horizontal (x) alignment a more reliable signal than vertical (y) alignment.
score = 0.55 × (|nx − px| / p_width)       + 0.35 × (|ny − py| / p_height)       + 0.10 × (1 − y_overlap_ratio)
+ size_penalty  # size_penalty = max(0, (n_area / p_area) − 0.08) × 3.0
The variables appearing in the formula are as follows.
-
px, py : the top-left coordinates of the problem box (reference point)
-
nx, ny : Upper left coordinates of the matching candidate number box
-
p_width, p_height : Width and height of the problem box. Used to normalize distance values to the size of the problem box.
-
y_overlap_ratio: the ratio of overlap between the problem box and the number box along the y-axis (0 to 1)
-
p_area, n_area: the area of the problem and number boxes. For calculating size_penalty
The lower the score, the better the matching candidate, and for each problem box, we selected the number box with the lowest score and connected them 1:1. The core design intent is as follows.
-
We normalized dx and dy to the width and height of the problem box, respectively, so that comparisons can be made even if the box sizes are different.
-
The item number tends to be aligned at the top left of the text, so I prioritized horizontal alignment by placing more weight (0.55) on the x-axis difference.
-
By also reflecting the y_overlap_ratio, boxes that are close in distance but do not overlap vertically at all were naturally pushed away from the matching candidates.
-
If the number box is abnormally large (exceeding 8% of the problem box area), a size_penalty is applied to suppress cases of large boxes being incorrectly matched.
As a result, it was possible to reliably reduce cases where items spanning two lines or adjacent items' numbers are measured to be closer than when using simple Euclidean distance.
Additionally, the fallback logic for OCR failure situations was very important. In the initial version, it was implemented to halt the entire batch in case of OCR failure, but in the actual operational environment, some OCR failures led to the entire process being halted.
To address this, we changed the logic to automatically assign a temporary identifier combining the page number and sorting sequence when OCR fails to extract meaningful numbers.
if not real_number: real_number = f"{page_num}-{i + 1}" # 예: "3-7"Thanks to this approach, even if some OCR failures occurred, the entire batch was not halted, and the data could continue to be passed on to the subsequent verification stage. As a result, we were able to achieve a significant improvement in terms of system resilience.
The table below summarizes the 4-stage pipeline explained above at a glance.
|
Step |
Module |
Processing Details |
Remarks |
|---|---|---|---|
|
1 |
Detection |
YOLOv8(Ultralytics) — problem · number box detection, confidence threshold filtering |
independent replaceable |
|
② |
Geo. Sort |
Split columns left and right based on the midpoint of the x-axis → Sort y-axis by column → Left → Merge right |
Independent interchangeable |
|
③ |
Matching |
problem ↔ number weighted score based minimum matching → question object composition |
independent interchangeable |
|
④ |
OCR |
number box crop → preprocessing (2x upscale · grayscale · binarization) → Tesseract / assign fallback identifier on failure |
independent interchangeable |
3. Application Results
Since we have not yet established a formal benchmark dataset, the results are organized based on observational data from the operational environment.
The greatest improvement effect was in the accuracy of restoring item order. In the existing OCR-centric structure, the error rate for item order was significantly high, and especially in the two-column layout, the problem of order mixing occurred frequently. However, after performing Vision-based layout analysis first, these errors were greatly reduced.
Additionally, with the ability to continue processing through a Fallback structure without halting the entire batch in case of OCR failure, operational stability has also greatly improved. In particular, the reduction in manual post-processing rates was very significant in terms of actual operational efficiency. Previously, it was often necessary for a person to manually correct the order for mixed layout pages, but after implementation, most of this could be handled automatically.
|
Evaluation item |
Before application |
Applied |
Remarks |
|---|---|---|---|
|
Question order error rate |
~23% |
~4% |
Operational Observation Criteria |
|
Batch interruption frequency |
Intermittent interruption |
Almost 0 cases |
Operational Observation Standards |
|
Layout mixed processing |
Manual post-processing required |
Automatic Classification |
Operational Observation Criteria |
|
Pipeline resilience |
Single failure → complete shutdown |
Isolated by Fallback |
Operational Observability Standards |
4. Limitations and Future Plans
Through this PoC, we were able to sufficiently validate the basic vision-based document structuring pipeline. However, there are still clear areas that require improvement.
Currently, there is still a lack of stability in processing complex layout documents with three or more layers or in dedicated formula boxes. In particular, areas that contain only formulas are different in characteristics from general text areas, so it is highly likely that a separate model or additional post-processing strategies will be needed.
In addition, the weights at the matching stage (0.55 / 0.35 / 0.10) and the size_penalty threshold (0.08) are values that have been heuristically tuned based on current operational data. In the future, as the dataset accumulates sufficiently, we are also considering automating the exploration of these values based on a validation set or replacing them with a learning-based matching model.
We also believe that refining the semantic connections between OCR results and Vision detection results will be an important task in the future.
In the future, we plan to expand the currently validated structure to cover web UI layout analysis and automatic generation of screen function guides. In particular, we expect that a significant portion of the current structure can be reused in the fields of screen capture-based component detection and UI structure analysis.
Through this experience, I was able to directly feel that there are many problems in the actual operating environment that cannot be solved by simple OCR alone. Ultimately, it was an experience that reaffirmed that what is important is not "reading the text" but "understanding the structure."
-
Ultralytics, "YOLOv8 Documentation", https://docs.ultralytics.com
-
Smith, R., "An Overview of the Tesseract OCR Engine", ICDAR, 2007.
-
Otsu, N., "A Threshold Selection Method from Gray-Level Histograms", IEEE Trans. on Systems, Man, and Cybernetics, 1979.
References
Junny