
The classic classic of performance analysis, Heap Dump
While working on a project in a K8s environment, we discovered a case where a specific pod was repeatedly restarting. To find out why the pod was restarting, we looked at the Last State property, and the cause was, of course, OOM. In most cases where a pod is infinitely restarting like this, the main reason is OOM Killed.
In this situation, to identify the cause of the OOM, we first check the Logs. However, even by reviewing the Logs, the cause of the OOM is not easily found. This is because the main cause of OOM is not an Error, but rather thread bottlenecks, meaning that DB I/O takes too long, leading to performance bottlenecks during asynchronous processing. In situations where memory gradually fills up and the pod dies without a single error log, it is difficult to pinpoint the cause based solely on the logs.
When it is not possible to analyze the cause of the OOM through Logs, the Heap Dump can be very useful. It is the most traditional process analysis technique and one of the most commonly used technologies for backend performance analysis to date. Heap Dump captures all objects in the JVM heap at a specific point in time and their reference relationships, allowing us to examine statically which objects are occupying memory and why they are not being reclaimed.
However, analyzing a pure Heap Dump as it is can be problematic because the file itself is not user-friendly and is not easily readable. It is virtually impossible for a person to interpret the original file where hundreds of thousands of objects and references are tangled in binary. In such cases, the Memory Analyzer Tool (MAT), an open-source analysis tool, can be very useful.
So what is OOM
Before delving into MAT, it is important to clarify exactly what OOM (Out Of Memory) is. OOM refers to a situation where the memory available for an application is exhausted, leaving no space to allocate new objects. Although it is a case of memory shortage, the level at which it occurs can be broadly divided into two categories, and distinguishing between these two is the first step in troubleshooting.
* Image Source: https://www.cnblogs.com/java1024/p/12381457.html
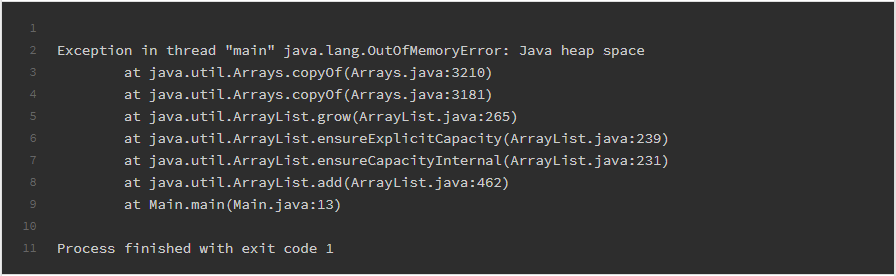
The first is the OutOfMemoryError that occurs within the JVM. The JVM sets a maximum size for the heap at startup and allocates objects within that limit. If unreleased objects continue to accumulate until the heap reaches its limit, the JVM throws a java.lang.OutOfMemoryError and halts normal operation.
* Image Source: https://suneeta-mall.github.io/blog/2021/03/14/wth-who-killed-my-pod---whodunit/
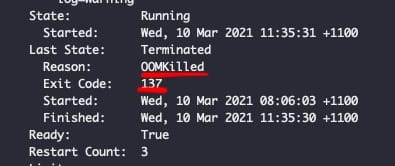
The second is OOM Killed occurring at the container level. In a K8s environment, pods are assigned memory limits, and if the actual memory used by the container exceeds this limit, the host's OOM Killer forcibly terminates the process. At this time, the pod leaves OOMKilled in the Last State along with exit code 137 (128 + SIGKILL 9), and will repeatedly restart according to the restart policy.
What complicates the problem is that OOM is mostly not an incident at a specific moment but the cumulative result of a gradual process. Objects that cannot be processed gradually accumulate in the heap, and even though the Garbage Collector attempts to collect them, they are still strongly referenced somewhere and ultimately fail to recover. The moment unresolved objects exceed the critical point, OOM occurs, which is why the logs at the point where the error occurs often show not the real culprit but rather the innocent code that failed to request memory last. Therefore, to identify the real cause of OOM, we must look not at the moment the error occurred but what was accumulated in the heap up to that point. At this point, Heap Dump and MAT for analyzing it become necessary.
Memory Analyzer Tool
The Memory Analyzer Tool (hereinafter MAT) is an open-source Heap Dump analysis tool provided by the Eclipse Foundation. It parses the raw Heap Dump (.hprof), which is difficult for humans to read, and visually shows how much memory is occupied by which objects and why those objects cannot be subject to GC.
The key to MAT is two indicators called Shallow Heap and Retained Heap. Shallow Heap represents the size of memory occupied by the object itself, while Retained Heap represents the total amount of memory that would be reclaimed if the object were to be GC'd. When looking for the cause of OOM, tracking objects with abnormally large Retained Heap is crucial. This is because the total amount of memory held and not released by that object indicates the actual scale of the leak rather than the size occupied by a single object.
* Image source: AnyLogic Help, “Memory analyzer”, https://anylogic.help/advanced/debug/memory-analyzer.html
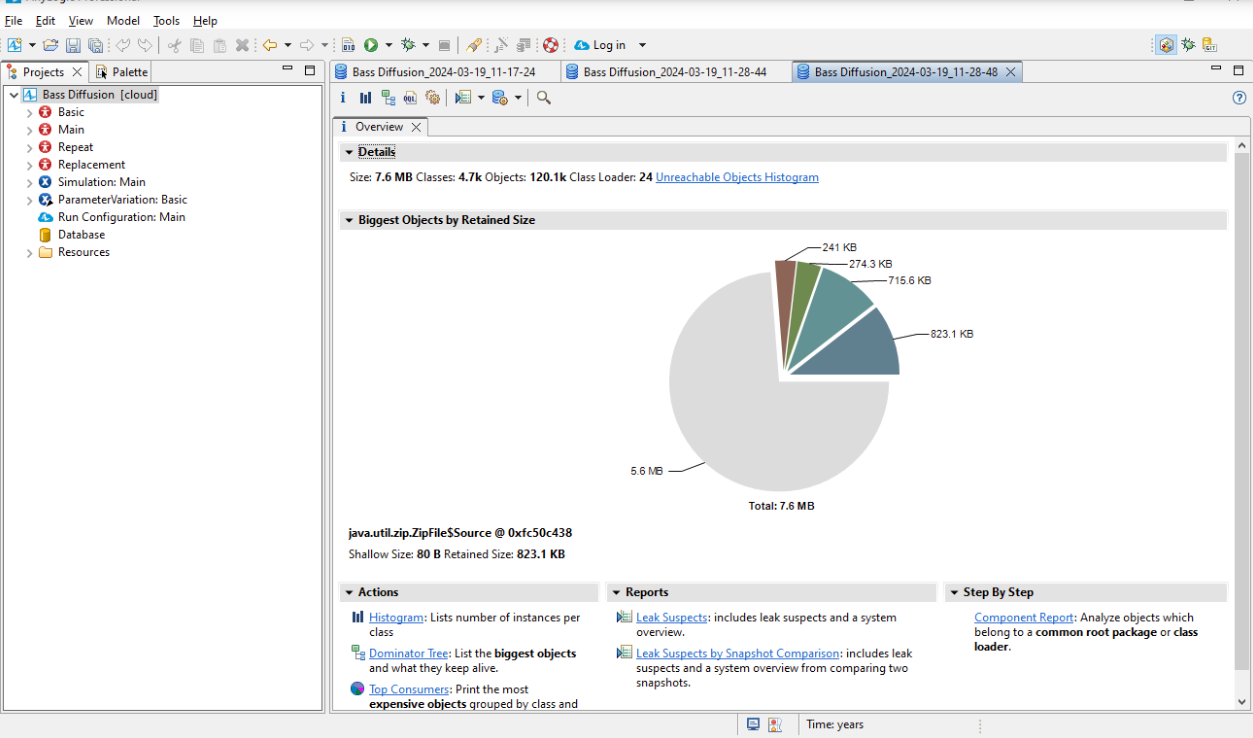
This View can be accessed by importing the Heap Dump file into MAT (Memory Analyzer Tool). It is a View that performs the core functions of the Memory Analyzer Tool, indicating potential memory leaks when MAT analyzes the Heap Dump. It shows the proportion occupied by the Process's Heap through a circular graph, allowing you to identify which data is excessively occupying the Heap.
* Image source: AnyLogic Help, “Memory analyzer”, https://anylogic.help/advanced/debug/memory-analyzer.html
You can also view screens like the following.
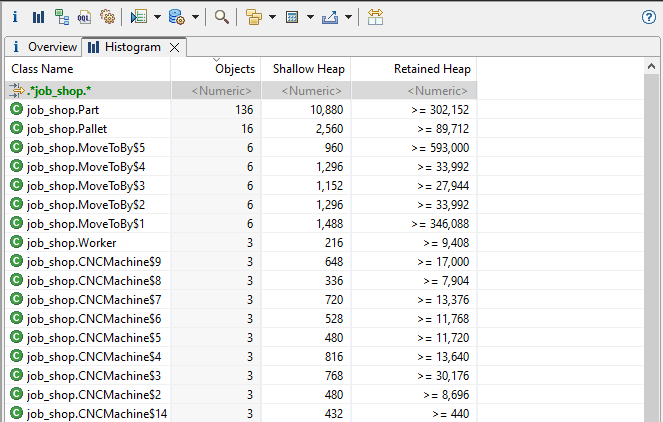
The above screen is the Leak Suspects report automatically generated after MAT analyzes the Heap Dump. MAT goes beyond simply listing objects; it identifies objects that occupy an abnormally large amount of memory as “Leak Suspects.” The circular graph at the top visually represents the share of each suspect object in the overall Heap, highlighting any single object or a cluster of instances of a specific class prominently if they occupy the majority.
At the bottom of the graph, a summary description of each suspect point is provided. It organizes information on how much Retained Heap is occupied by which class, and how that object is maintained through which ClassLoader or reference path in a natural language format, helping developers unfamiliar with Heap Dump analysis to quickly narrow down potential causes of leaks. This screen is useful as a starting point to identify the direction of analysis before diving into detailed Dominator Tree analysis.
Heap Dump extraction method
Heap Dump can be set to be automatically generated at the moment of OOM or can be extracted by issuing a command to the running process directly. Capturing the state at the moment when OOM occurs is crucial in production environments, so setting up automatic dumps via JVM options is effective.
By adding the -XX:+HeapDumpOnOutOfMemoryError option, a .hprof file will be automatically generated at the time OutOfMemoryError occurs, and the save path can be specified using -XX:HeapDumpPath. If immediate extraction from the running process is needed, the jmap -dump:live,format=b,file=heap.hprof <pid> command can be used. The live option will perform a Full GC before the dump, allowing analysis of only the surviving objects.
However, in K8s environments, there is one consideration. The moment a pod is killed due to OOM, the container terminates, which may lead to the dump file generated inside disappearing as well. Therefore, it's necessary to specify HeapDumpPath to a persistent storage path like PersistentVolume or consider accessing the file system just before termination through a separate debug container.
Tracking leak objects using Dominator Tree
In a scenario where memory usage was continuously increasing, the Heap Dump extracted revealed through MAT's Dominator Tree that an instance of a particular class was occupying abnormally high Retained Heap. The Dominator Tree visually presents the dominance relationships between objects in a tree structure, allowing you to quickly identify which object is holding onto the memory of other objects.
To determine why objects that should have been reclaimed at a certain level continued to accumulate, I utilized the Path to GC Roots function. This function traces the reference path from the object back to the GC Root, precisely indicating who holds onto the object and does not release it. The analysis showed that message objects inflowing at a rate exceeding processing speed continued to be loaded into the collection without being consumed, remaining as strong references, preventing the Garbage Collector from reclaiming the memory.
Ultimately, due to a DB I/O bottleneck in the asynchronous processing, the speed of message consumption could not keep pace with production speed, leading to an infinite accumulation of unprocessed objects in the heap, resulting in OOM. Fortunately, this fact was discovered through the Heap Dump analysis process, and by improving the DB I/O of the business logic to reduce processing speed, the situation of infinite object accumulation was prevented.
In conclusion
Heap Dump is the most reliable tool for identifying the culprit of an already occurred OOM. When faced with memory leak issues that are not visible in logs and difficult to narrow down the cause with real-time metrics, it is helpful to think of it as a classical analysis technique that allows you to look at the heap at that moment and unravel the tangled web of object references. Above all, Heap Dump analysis not only helps to resolve the immediate problem but also provides an opportunity to deeply understand the lifecycle of how objects are created and destroyed, and what reference relationships hinder memory reclamation. The experience gained from such analysis is valuable as it allows for quicker recognition of similar symptoms and leads to the insight to design structures that prevent leaks in the future.
jungboke