
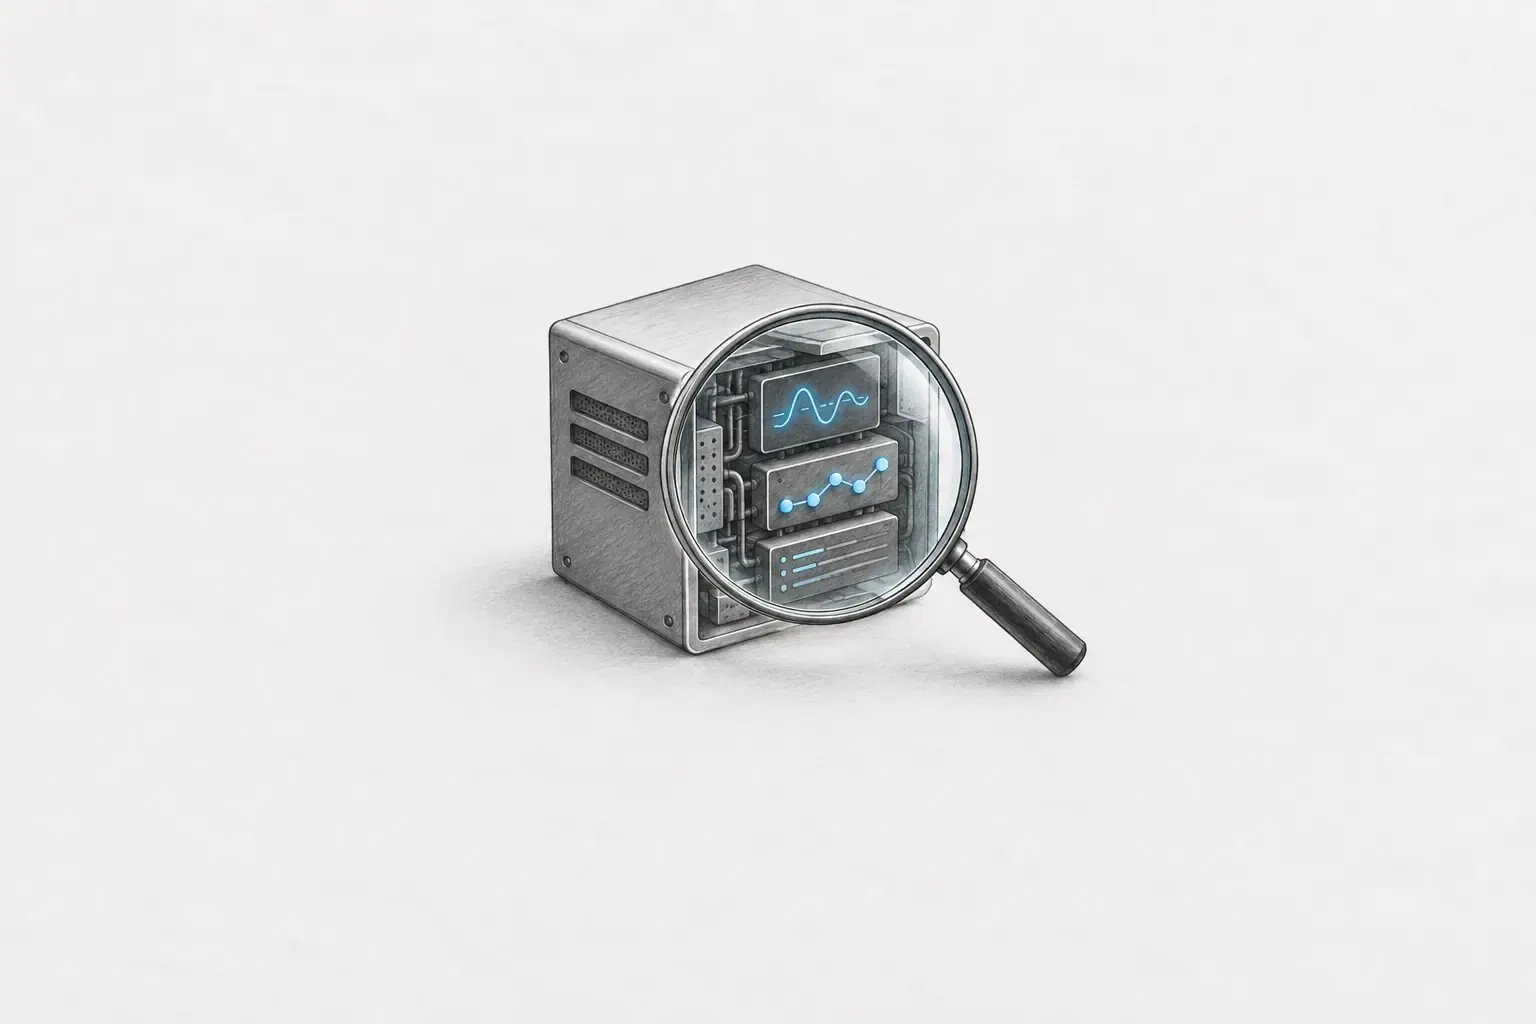
What Is Observability?
Originally a term from control theory, observability refers to how much we can determine about a system’s internal state by looking only at the outputs that emerge from outside the system. Applied to software, it becomes this: Can we explain a problem using only the data currently being produced, without accessing the server directly or modifying the code to add more logs?
The key point is that it is not limited to answering questions defined in advance. “Notify me when the response time exceeds three seconds” is a predefined question. In contrast, “Why did uploads fail only on a specific device yesterday afternoon?” is a question that could not have been defined beforehand. If you can ask questions like this later, the system is observable. If you cannot, you have to modify and deploy the code, then wait for the problem to happen again.
It may sound obvious when put into words, but to understand when the distinction actually matters, you need to look at a real service.
Why Is It Needed for BanJang Note?
BanJang Note is an app that connects construction-site foremen and team leaders. It moves job postings, applications, document submissions, and attendance records that were previously exchanged through chat and text messages into an app. When a team leader posts a job, a foreman applies, the team leader reviews the submitted documents and requests corrections for anything missing, then assigns selected workers to the team and records their clock-in, clock-out, and daily wages.
This is what matters in the architecture. It uses other microservices on the internal platform for user identification and authentication, document storage, notifications, payments, and more. The BanJang Note server runs its own business logic, but it also orchestrates the flows of each microservice to perform more complex functions.
Let’s consider one situation. We receive a report saying, “Document submissions have occasionally been failing since yesterday.”
The problem is the word “occasionally.” If you try ten times, it works nine times. The server is up, the CPU is normal, and no error alert has arrived. None of the metrics we were watching looks unusual. When we try to reproduce it locally, everything works fine.
Even if we dig through the logs, we are stuck from the outset on which keywords to search for and which time range to examine. Moreover, this request is not handled only by our server. It goes through authentication and calls the file storage service, so the fact that nothing unusual appears in our logs does not mean there is no problem. We need to be able to select one failed request and trace how far it went and where it stopped. Without the means to do that, all we can do is guess.
This also reveals why monitoring is only half the picture. Monitoring means watching for known problems. Notify me when the disk is full; notify me when the error rate exceeds 1%. You can set a threshold only if you already know what is dangerous. But many real incidents arise from combinations we did not anticipate. A problem that occurs only in a specific app version and during a specific time period cannot be covered by a predefined alert, because we did not know what combination to look for.
In short, monitoring makes an alert go off, while observability lets you find the reason after an alert goes off—or for a problem that never triggered an alert at all. If you have only alerts without data to investigate, you can do nothing but guess during an incident. If you only accumulate data without alerts, the user will discover that something is wrong first. You need both.
The Three Pillars of Observability
Metricsare numbers accumulated along a time axis. Examples include request counts, response-time percentiles, and error rates. They are lightweight and can be retained for a long time, but individual events disappear. You may know that the error rate is 2%, but not who failed or why. Because a time series is created for each combination of labels, you should not include high-cardinality values such as user IDs.
Logsare records describing what happened at a particular moment. They are the most detailed, but also voluminous and expensive. If you store only sentences that are easy for people to read, it becomes difficult to search by conditions later, so it is better to preserve them in a form that separates keys and values.
Tracesare the path taken by a single request through the system. They are the only data among the three viewed at the request level, filling the gap between metrics, which lose individual events, and logs, which lose the overall flow.
Taken separately, each of the three is only half the picture. In practice, they connect in sequence. Metrics report that the failure rate has risen from 0.1% to 4%. Traces open up the paths of failed requests and show that they all stopped in the file-service segment. Logs tell us what parameters were used to make the call in that segment and what response was received. What is abnormal, where the problem is, and why it happened are narrowed down in that order.
The glue connecting these three is the correlation ID. When a request arrives, we create a trace ID and attach the same ID to every service it passes through and every log line. Then, from the slow segment seen in a trace, we can click through directly to the logs for that segment. Without this, the three are merely separate piles of data, and we end up seeing a graph spike and manually estimating the time range in the log search box. That is closer to a search than to observation.
Tracing Becomes Necessary When Services Are Split Apart
Observability became essential rather than optional when systems began to be divided into multiple services.
In a monolithic service, when an exception occurred, the stack trace contained the entire cause. But when services are split apart, that disappears. A stack trace cannot cross boundaries between servers, and our logs contain only “call failed.” We can open the logs of another microservice, but the problem is that among all those lines, there is no way to identify which ones belong to our request. It is not a question of whether we have permission to view them, but whether we have a way to connect them.
Several factors overlap here. We may call five services to render a single screen, but if just one fails, the response may still go out as 200 and the failure may not appear in the error rate. Deployment cycles also differ by service, so something that worked until yesterday may stop working even though we have not deployed anything. If we cannot distinguish whether a failure was caused by our code or by another service, incident response becomes an exchange of requests to check with each other rather than an effort to trace the cause.
Moreover, metrics and logs alone are difficult to rely on in this situation. Each service’s metrics say that it is operating normally. If five services each take 200 milliseconds and those times accumulate sequentially, the user may be waiting two seconds, but the combined picture does not appear when looking at individual metrics. Even if logs are centralized, a chronological listing is different from the flow of a single request. When calls are made in parallel or move asynchronously, chronology alone cannot reveal the causal relationship.
Tracing does what these two cannot. It uses a single request as the unit, records which calls led to which other calls through parent-child relationships, and records the duration of each segment. It reconstructs scattered facts in causal order rather than chronological order. This lets us answer questions such as: Where did this request actually go? Which segment consumed time out of the total two seconds? In a chain of failures, where was the actual point of origin, rather than the noisiest location? Are we calling the same service eight times within a single request?
The point becomes clearer when applied to BanJang Note. A single document submission involves one request that passes through authentication to identify the user, sends the file to the file storage service, stores the result, and then sends a notification to the other party. The code we wrote accounts for only part of this, which means failures occur not “inside the BanJang Note server,” but between services. The closer a feature is to the flow of individual microservices, such as documents and notifications, the more of its actual processing takes place outside our process.
Without traces, all we have on our side is one line saying “Document submission failed.” With traces, we can immediately see that authentication finished in 20 milliseconds and that the request stopped during the file storage call. Clicking that point opens the logs, showing what request was sent and what response was received. Finding the cause becomes a matter of checking what response came from which segment, rather than debating which team is responsible.
The process is long. Applying for a job posting, having the team leader review the application, being selected, waiting, being assigned to a team, and having attendance confirmed all involve multiple steps. If one step in the middle fails silently, the user’s screen may not even show an error. Nothing simply happens. When we receive an inquiry saying, “I applied, but I haven’t heard anything for days,” almost the entire response consists of retracing how far the request got and where it stopped. This is where it matters whether a path remains recorded at the request level.
You cannot ask the user for more information. The people who use BanJang Note are workers and managers working on site. It is nearly impossible to ask them to open developer tools or try again and tell us what happens. To start with Customer Service and identify the cause, the system must retain what happened at that moment.
Conclusion
Put in one sentence, observability is building a system so that you can ask, later on, questions you did not anticipate in advance.
The thing to watch out for is assuming that a system is observable simply because you have connected some tools. Adding a library and starting a collector is only the beginning. Whether the signals actually reach storage, who looks at them once they arrive, and who is notified when something looks abnormal are all part of the same whole. If even one of the three is missing, it is effectively the same as having no observability.
When writing code, we tend to think first about cases where everything works. But what consumes time in operations are the cases that go wrong once in a while, and when services are split apart, it can be difficult even to determine where the problem originated. Each time you build a feature, it is worth asking yourself: If this goes wrong at three in the morning, what will I look at to find the cause?
Ted