

Server Downtime Caused by Exceeding the TPS Limit
While configuring a pipeline to retransmit data collected onboard to a land-based data lake, we encountered a situation that required threshold testing. To retransmit messages stored in the onboard pods to the land-based data lake, the messages had to pass through two relay segments, EMQX and CCMD, because these segments had a limit on the number of messages they could process per second—that is, a TPS limit.
Because communication environments were unstable on several vessels, data often failed to arrive, so the system was designed to request all data that had not been received through batch processing from the data lake at once. Under normal traffic, the volume was well below the TPS limit, but during the brief moments when the batch logic ran, several times that amount of messages poured in simultaneously. If a pipeline designed around the average inflow could not withstand these moments, the servers in the relay segments would go down, and messages would be silently lost without producing even a single error.
Ultimately, what we needed to know was not “How many messages per second can this pipeline process?” but rather “When a sudden surge occurs, where does it fail first, and how long does it take to recover?” A conventional load test that maintains a constant load for an extended period could not answer these questions, so we chose a Spike Test.
So, What Is a Spike Test?
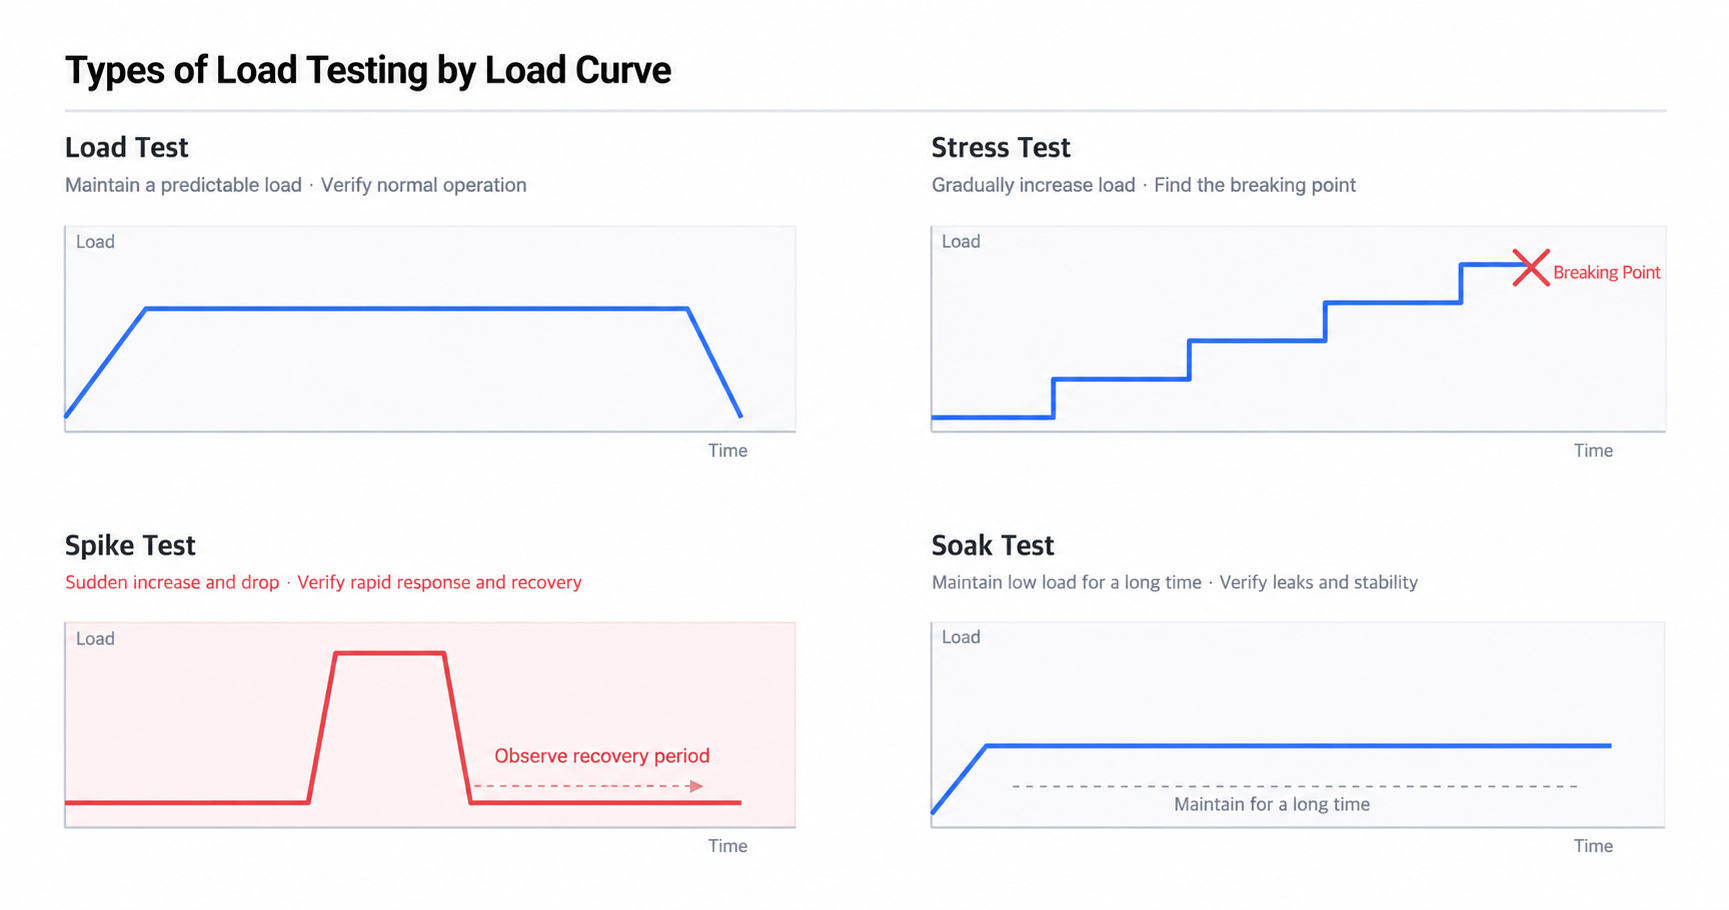
Before looking at the test design in detail, it is worth clarifying how a Spike Test differs from other types of load testing. Load tests can broadly be divided into four types according to the shape of the applied load. A Load Test maintains the expected normal load at a constant level to verify normal processing. A Stress Test gradually increases the load to find the threshold at which the system breaks down. A Soak Test maintains a low load for an extended period to identify problems that only emerge over time, such as memory leaks or resource exhaustion.
In contrast, a Spike Test rapidly increases the load over a short period and then rapidly decreases it again. The decisive difference from other techniques is that it focuses not on maximum throughput itself, but on the system’s response and resilience to sudden changes. It examines how much the queue builds up when the load surges, at what point the error rate and data loss begin to occur, and how long it takes to return to the original state after the load disappears.
By definition, retransmission traffic has the shape of a spike. It remains low under normal conditions, rises vertically only when reconnection occurs, and falls back to its original level after all backlogged messages have been sent. If real traffic has this shape, the test must have the same shape to produce meaningful results.
Retransmission Path and Bottleneck
The path under test began at the onboard pods and continued through EMQX and CCMD to the land-based data lake. When the onboard pods published their stored messages to EMQX, CCMD received them and relayed them to the land-based segment, where they were ultimately loaded into the data lake. In a pipeline composed of multiple serial segments, overall throughput is determined not by the average but by the segment with the lowest upper limit. In this path, that role was played by the relay segments subject to the TPS limit.
We also needed to document in advance what could happen when the TPS limit was exceeded. Excess traffic could be throttled, causing delays to accumulate; messages could continue piling up in the queue until backpressure was applied; or, in the worst case, connections could be terminated or messages could be dropped. Particularly problematic were cases in which the publishing side recorded the messages as successfully sent even though they never actually reached the data lake. Because such losses could never be detected by looking only at the publisher’s logs, it was essential to validate the system by comparing the number of published messages with the number ultimately received.
Test Design
The Spike Test was intended to verify three things. First, which segment exhibited problems and in what manner when the TPS limit was exceeded. Second, where the practical upper limit was at which messages could pass through without loss. Third, how long it took for the backlog to clear and the system to return to a normal state after the spike had passed.
The load curve was designed to replicate an actual reconnection scenario. We briefly maintained the normal baseline level, then rapidly increased the load vertically to several times the target TPS over a short period, held it there for a set amount of time, and then rapidly dropped it back to the baseline to observe the recovery process. If the ramp-up period is made too long, the load rises gradually and the test effectively becomes a Stress Test, so it is important to keep the ramp-up period intentionally short.
We collected observability metrics separately for each segment. On the publishing side, we monitored the actual publishing TPS and successful and failed responses. In the relay segments, we monitored EMQX’s inflight and queued message counts, along with CCMD’s processing latency and error rate. On the receiving side, we checked the number of messages received by the data lake. We also included a publish-time timestamp and sequence number in each message so that end-to-end latency and loss rates could be calculated simultaneously.
How to Perform a Spike Test
A Spike Test can be performed with load-testing tools such as k6, JMeter, and Gatling. However, if the goal is to validate a TPS limit, it is important to choose a tool that can directly control the number of requests per second rather than the number of virtual users. When load is generated based on the number of virtual users, the actual publishing rate decreases as responses become slower, preventing the very overload condition that needs to be verified.
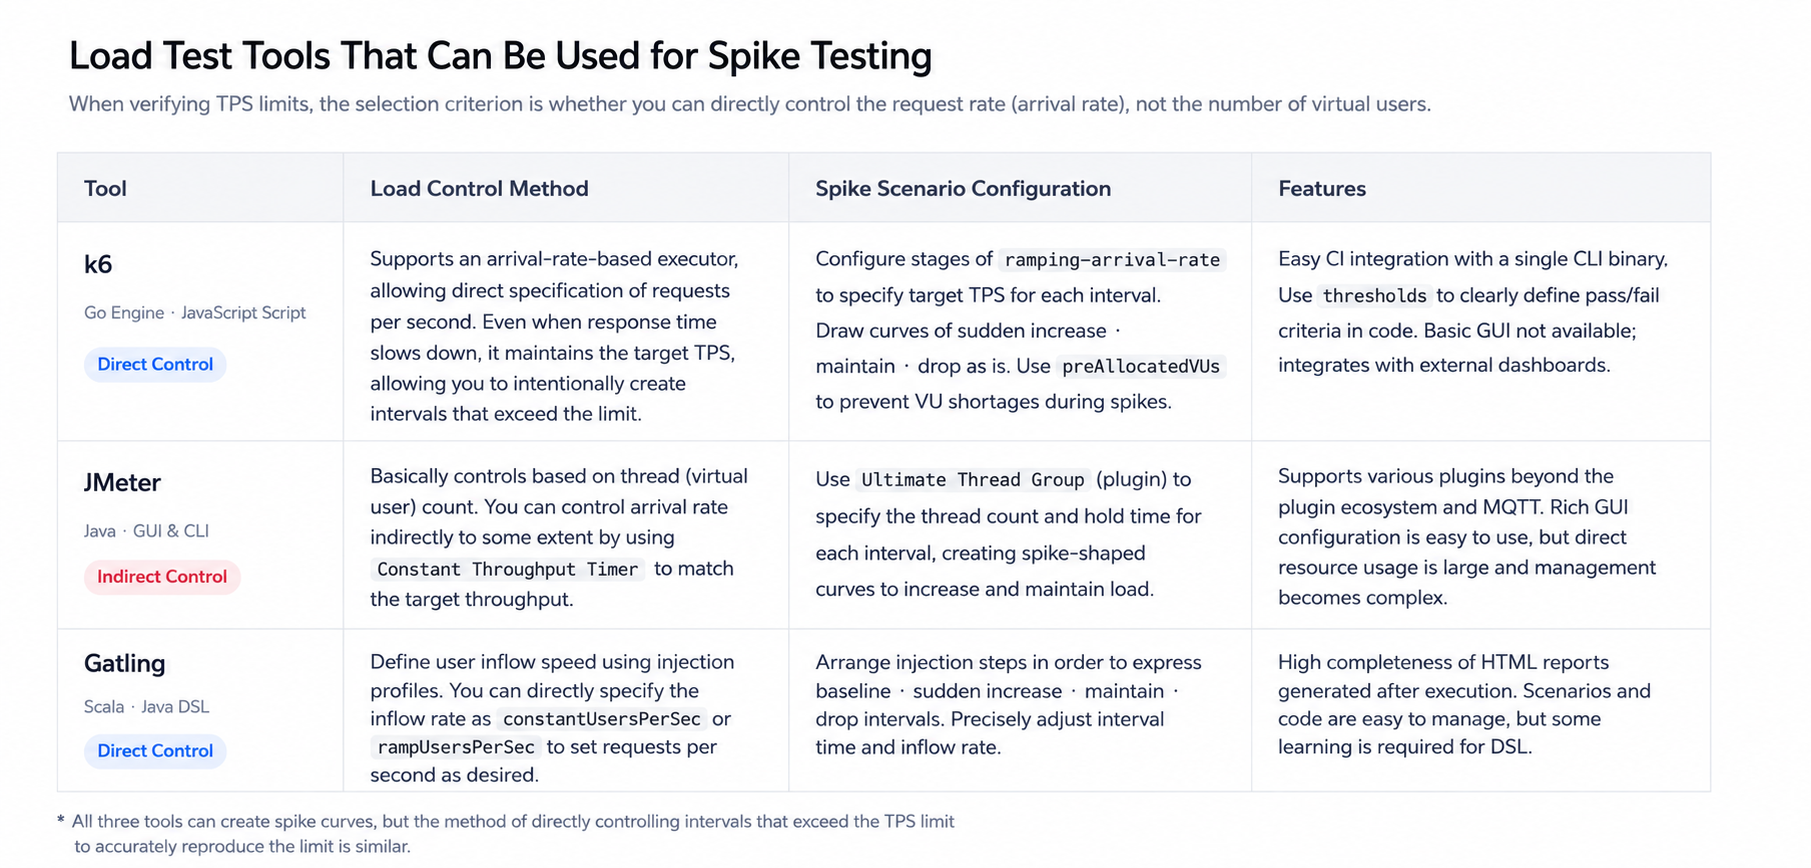
When using k6, the ramping-arrival-rate executor is best suited to this purpose. It allows you to specify the target TPS for each segment directly with stages, so you can shape the baseline and spike sections as desired. By allocating sufficient preAllocatedVUs and maxVUs, you can also prevent the actual ramp-up from being blunted by the need to create new virtual users at the moment the load surges. With JMeter, the same type of curve can be created by combining Ultimate Thread Group with Constant Throughput Timer.
When performing the test, make sure that the load generator itself does not become the bottleneck. If the load generator runs on the same node as the target system or has an insufficient connection pool, the test tool may hit its limit before the relay segments do, producing results that differ from reality. Also, do not terminate the test immediately after the spike ends. Maintain the baseline state for several more minutes so that the recovery process, including the clearing of backlogged messages, can be observed.
Problems in the Retransmission Logic Revealed During the Spike
We performed a Spike Test using a scenario designed around the issue in which some messages were lost after reconnection. We confirmed that, starting at the point where the TPS limit was exceeded, some messages were recorded as successfully transmitted on the publishing side but never reached the data lake. Comparing the sequence numbers showed that the losses were concentrated after a specific point within the spike period.
To determine why messages were arriving all at once instead of flowing at a rate the relay segments could handle, we examined the retransmission logic and discovered that it was immediately publishing all stored messages sequentially in a loop, without any rate control. Even more problematic was that failed messages were retried immediately, adding retry traffic to relay segments that were already saturated and thereby making the situation worse on its own.
Ultimately, when communication was restored, the accumulated messages poured in at several times the TPS limit, saturating the relay segments. The delays caused by throttling combined with immediate retries, causing the backlog to grow like a snowball and eventually resulting in the loss of some messages.
Fortunately, we were able to discover this through the Spike Test. We added token-bucket-based rate limiting to the retransmission segment so that messages would flow at a uniform rate below the TPS limit, and changed the retry behavior to use exponential backoff on failure. This prevented a sudden traffic surge from bringing down the relay segments. When we ran the same scenario again after the improvements, all messages were loaded into the data lake without loss, and the time required to clear the backlog after the spike fell within a predictable range.
Conclusion
A Spike Test is a tool for verifying not “How fast is this system?” but “How does it withstand unexpected moments, and how quickly does it return to normal?” Systems designed only around average traffic generally operate without problems under normal conditions, so vulnerabilities exposed by sudden surges rarely become visible until they cause an incident in production.
If a system contains logic that inherently generates bursts, such as retransmission or retries, and has a TPS-limited segment in front of it, a Spike Test is a tool worth running at least once after functional verification has been completed.
jungboke