

Part 1. Data Visualization and Collaboration Process
1. Background: Constraints of Agile Methodology and SI Ecosystem
1.1. Essence of Agile Methodology: Agile Response and Flexibility to Change
In the modern software engineering ecosystem, the value of Agile has been continuously emphasized as a methodology to respond to high uncertainty in market environments. The essence of Agile methodology lies not in strictly adhering to a pre-established fixed plan, but rather in its ability to respond quickly and flexibly to changesthat occur during the course of a project.
The core process that Agile pursues is the ongoing delivery of usable software through repeated short development cycles (Iterations or Sprints), incorporating feedback gradually into the product.
1.2. Awareness as a Development PM and the Direction of Project Management System (PMS) Development
From the perspective of development PMs who are enhancing projects in various business domains, I have investigated the current status of several collaborative tools and Project Management Systems (PMS). In this process, I identified the necessity for software solutions that enable single squads to maintain Scrum values while managing backlogs, leading to the planning of the Agile-based PMS project, DevLime.
However, reflecting on previous project experiences and analyzing the execution environments across various industries, I became aware of the phenomenon of 'fake agile' that occurs in the SI project environmentwhich plays a significant role in the domestic software development landscape.
This is not simply a matter of team members' proficiency, but rather a structural limitation caused by the inability of market-standard PMS tools to smoothly accommodate the specific contractual characteristics of certain implementation environments. I realized that if we fail to alleviate this friction at the system architecture and process layer, the utility of the tools will inevitably diminish.
1.3. The Wall of Reality: Structural Contradictions of the SI Ecosystem Requiring Quantitative Indicators within Fixed Deadlines
SI projects typically have a conventional waterfall structure, based on a predetermined budget, fixed duration, and clearly defined scope of work (RFP). The client, as the contracting party, expects that the functional requirements stated at the time of contract, for the purpose of risk management, will be accurately implemented by the final delivery date.
If the agile process, which has the advantage of flexible changes and gradual detailing of requirements in such an environment, is transferred as is, management conflicts arise.
Even after there is a mutual agreement to adopt the agile method, clients tend to continuously request quantitative indicators to confirm project control.
"What is the exact percentage of overall progress compared to the current requirements?"
"Please demonstrate with a quantitative task list by mapping the task IDs of the WBS (Work Breakdown Structure) submitted at the time of the contract one-to-one with the current tasks, regardless of the fluctuations in the sprint backlog."
As a result, the development team faces a dual management structure where they must operate agile sprints internally while separately calculating waterfall-style metrics for external reporting.
2. Problem Definition: Administrative Overhead Caused by Agile Reporting
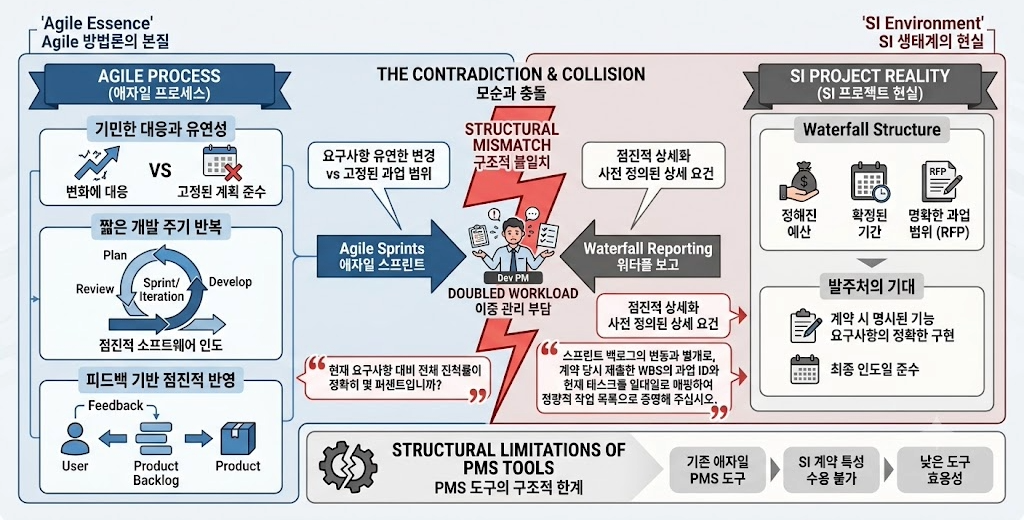
The administrative fatigue that arises in the SI project environment is due to the resources managed by the development team and managers being excessively spent on reworking reporting data rather than on improving the quality of the software product. The main pain points can be defined in three areas:
2.1. Inversion of Main and Sub: Backlog that has been distorted into 'data for client reporting' instead of a development plan
In the agile framework, the backlog is a living document that is flexibly refined and prioritized by the team to deliver user value. Ideally, a healthy backlog size that a single squad can clearly recognize and focus on during a sprint is about 20 items.
However, the moment it is combined with a reporting system that needs to prove compliance with the contract scope, backlog tickets are transformed from practical guidelines into a list of work evidence for client submission.
Individual sentences in the project plan or components in the screen definition documents are excessively subdivided to forcibly synchronize with waterfall-style requirement traceability, leading to the number of backlogs swelling into the hundreds, creating management blind spots.
2.2. Resource Black Hole: Fatigue of Manual Documentation and Tracking of Frequently Changing Backlog Items
It is natural for the details and story points of the sprint backlog to change due to technical constraints or requirement concretization during the software development process. However, such fluidity is easily recognized as a management risk by client managers who require quantitative and consistent weekly reporting.
To bridge this gap, project managers (PMs) and lead developers continuously expend administrative effort. The work of manually reworking frequently changing backlog data extracted in file form into waterfall templates for reporting to client executives using Excel or PowerPoint is repeated, resulting in the tools themselves becoming a resource black hole that lowers the productivity of the project.
2.3. Psychological Fatigue: The Distortion of Daily Scrums and PMS Becoming a Tool for Surveillance
When the status information of the backlog begins to link to an absolute standard for external reporting beyond the autonomous progress sync within the team, the nature of the daily scrum that takes place every morning will also change.
There is a phenomenon where the meeting, which should be a place for transparently sharing technical bottlenecks and risks to seek solutions, is fading into an administrative report that proves and defends the filling of numerical figures on quantitative indicators.
As a result, the reliability of the data collapses, increasing administrative fatigue among team members.
3. Solution Process: An Approach Centered on Data Visualization and Collaboration Processes
To overcome this problem, it is not through the establishment of complex rules that force or restrict developers' actions.
It is necessary to establish a 'real-time multidimensional dashboard visualization pipeline' that transparently proves the data flowing in real-time within the project management mechanism, and to aim for a design direction that recovers the 'essence of agile collaboration processes' and systematically absorbs administrative friction.
The contents discussed in this session are the results of contemplating how to fundamentally solve the issues of methodology distortion and fake agility while operating the initial planning and actual development of the DevLime project in an agile manner.
3.1. Architecture Philosophy: Building a 'Real-time Feedback System through Data Visualization' Instead of Imposing Rules
Many project management systems impose artificial workflow locks or excessive input constraints to prevent the backlog from becoming a graveyard. However, in the field of SI projects with high structural volatility, numerous variables can arise depending on the contract structure and the client's tendencies.
The moment rules are enforced, the process becomes rigid, so instead of administrative constraints, it is much more effective to implement a 'real-time feedback system' through a multidimensional dashboard that maximizes the visibility of increasing data, enabling the team to autonomously recognize the status.
3.2. Diversification Design of Data Visualization Dashboard by Team Role
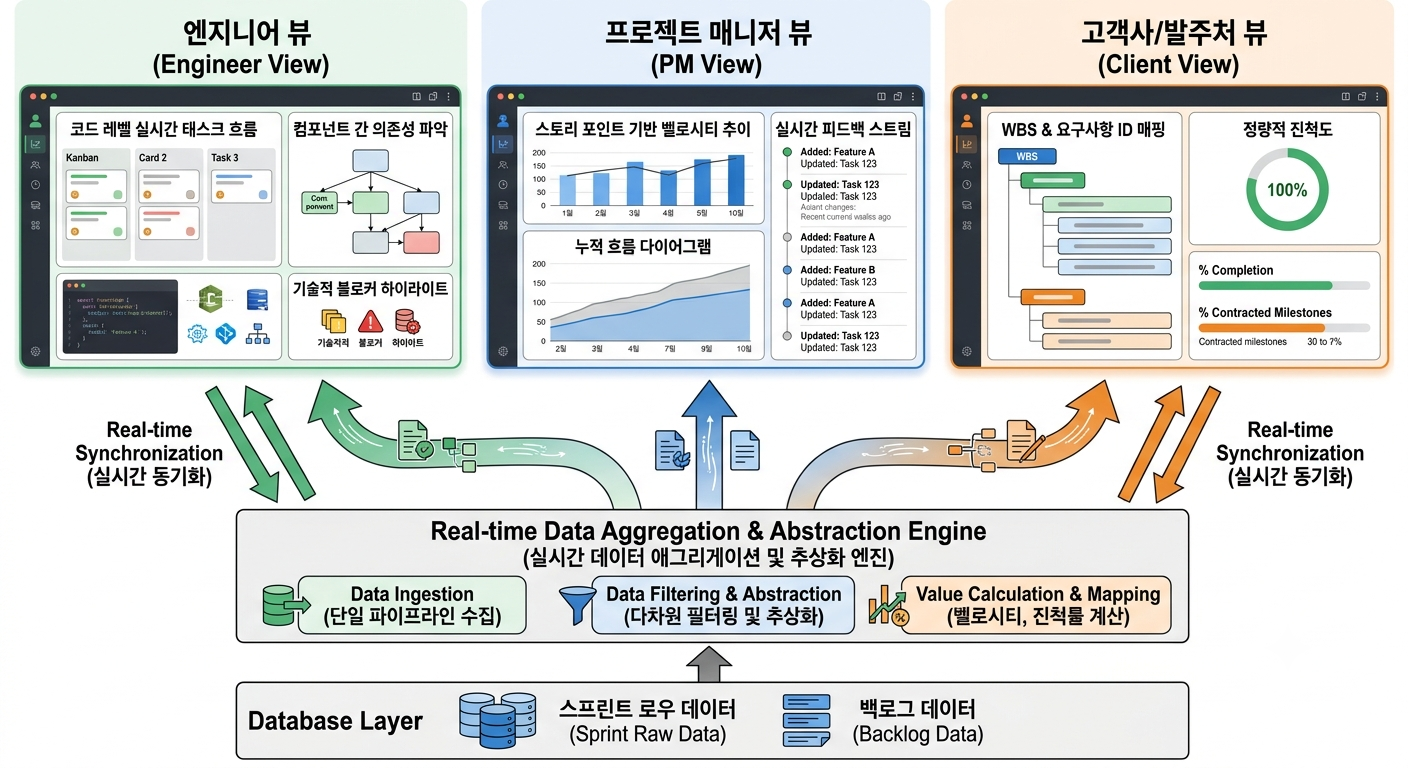
Although it is said to be data with the same characteristics, the structure that expresses all information on one screen causes an excess or deficiency of information depending on the organizational members.
Collect the sprint raw data from within the system through a single pipeline, Providing a multidimensional data abstraction dashboard view by user roleYou can.
-
Engineer View:It provides a Kanban-based view that intuitively captures the dependencies between real-time task flows at the code level and architectural components. By visually highlighting the core technical issues faced by individual engineers and infrastructure bottlenecks, it can create an environment that encourages developers to focus solely on the context of their core functionality implementation, such as complex queries or data modeling.
-
Project Manager View (PM View):Provides a view that integrates the trend of team velocity based on story points and the cumulative flow diagram. Especially occurs frequently in practice.Real-time changes to adding, deleting, story points, and value scores of the backlog are aggregated and visualized in real-time without a separate meeting.Designed to help administrators continuously monitor risk signals across the project and proactively defend against schedule overflow.
-
Client View:We boldly move away from fragmented technical terms and detailed ticket units centered around engineering, providing a view tailored to the client's perspective.Mapping WBS (Work Breakdown Structure) and requirement IDs to a quantitative matrix of real-time Agile backlog completion rateBy showing it, we aim to provide a strong quantitative assurance to the client manager that the project is under complete control within the scope of the contract through a progress tracking view.
3.3. Compliance with Agile Collaboration Processes for Sharing Work Context
In order to fundamentally reduce the resources needed to manually break down and quantify the backlog for report writing, The work context between development elements and planning is naturally shared within the 'Agile collaboration process itself' rather than in a separate document.You need to create an environment where it works.
-
Story-centered context binding:Instead of sharing project plans or changes in fragmented external documents, all planning background is closely integrated within the top-level user stories of the sprint. Developers can immediately check the planning history within the relevant ticket before starting coding, which helps reduce communication overhead.
-
Focusing on Backlog Refinement:The main concern of refining the backlog is not merely the act of correcting text, but the actual executionClearly share the scope of the backlog and precisely adjust story points and value scoresIt must be aligned. Through this process, the ambiguity of the backlog will be clarified and the entire team will be able to view the same priorities.
3.4. Daily Scrum Optimization: Maximizing Communication Density and Preventing Time Waste Processes
To prevent the daily scrum that takes place every morning from deteriorating into a meaningless list of reports or becoming lengthy due to discussions on specific issues, we need to establish a compact operating process that refines communication rules and minimizes meeting time.
-
Share key milestones and common progress affecting the entire team:In meetings, we aim to prioritize syncing only key milestones and common progress updates instead of listing the individual, task-specific details of each team member.
-
Sharing of major issue pre-drafts:Before the daily scrum meeting begins, all squad members mustWrite down the major technical issues or scheduling issues you are facing in advance on the dashboard and shared feedWe adhere to the rules laid out. This establishes a foundation for visually recognizing risk factors immediately upon the timely start of the meeting.
-
Preventing time wastage through issue topic separation:When an in-depth discussion on a specific technical challenge begins during the daily scrum, the focus of unrelated team members deteriorates, resulting in a significant waste of time. Therefore, during meetings,Share only the topic and risk status of the issue, and then immediately stop the discussion, proceeding with a separate meeting involving only the actual relevant team members after the daily scrum ends.The daily scrum is conducted as briefly as possible to maximize the efficiency of the meeting.
3.5. Management and Reporting Resource Savings through Visualization-Based Sharing
The existing document-centered reporting system, which involved exporting and processing data in Excel weekly to meet the quantitative indicators and progress required by the ordering party, must be boldly discarded. Instead, we need to consider a visualization system that can provide real-time updates. For example, we can track the fluctuations of backlog data in real-time and always provide an updated view with visual charts and progress rate scales.
This is organized Directly share the dashboard with the project manager, or if necessary, immediately provide a real-time visualization snapshot of the dashboard as supporting documentation.You can report and switch the process.
If such a visualization-centered sharing environment is established, PMs and senior developers will be freed from the administrative waste of processing reporting data, and the client will be able to gain quantitative assurance of project control by viewing the transparently opened visualization indicators in real-time.
4. Next steps for process enhancement
In Part 1, Characteristics of Constraints and Contract Structures in the SI EcosystemWe diagnosed the reality of the distorted agile methodology due to. The deterioration of the backlog, documentation fatigue, and daily scrums that are faded by formal reporting, etc.The reality of administrative overhead faced by practitionersdefined.
To solve these problems, instead of enforcing artificial workflow controls or rules, data should be transparently separated and abstracted.Data visualization and collaboration process-centered solutionssuggested. Diversified the data layer according to the role and purpose of the viewer.Team Role-Based Dashboard View Designorganically linking the planning background within the ticketWays to Share Work Context focusing only on technical bottlenecks and risk factors Daily Scrum Optimization Rules and Management resource reduction plan through visualization-based sharingFounded the basis for practical process architecture, such as.
If Part 1 laid the groundwork for securing visibility and reducing administrative friction through multidimensional visualization, the next series will reflect this design philosophy from an agile perspective.DevLime Development Planning Directionto share, and furthermore, to eliminate the fundamental human input fatigue and cognitive overheadHow to intelligently scale the PMS system through the introduction of AII would like to address the content.
5. References
5.1. Popular Agile Guides and Scrum Values
-
Ken Schwaber, Jeff Sutherland, "The Scrum Guide" (Latest Edition)
-
Reference context: This is a globally recognized guideline that easily illustrates the concepts of uncertainty response, flexibility, and periodic feedback loops through sprints emphasized in '1.1. The Essence of Agile Methodologies'.
-
-
Robert C. Martin, "Clean Agile" (Insight, 2020)
-
Reference context: This popular book provides an intuitive and straightforward explanation of why the essence of agile deteriorates, and the administrative overhead and fake agile phenomena that practitioners tend to fall into, from a developer's perspective.
-
5.2. Project Management Standards and Hybrid Environment Analysis
-
Project Management Institute, "Agile Practice Guide" (PMI, 2017)
-
Reference context: This presents a hybrid approach that alleviates the quantitative progress pressure and management friction that arise from the combination of waterfall structure and agile sprints, addressing the uniqueness of the domestic SI environment discussed in '1.3. The Wall of Reality' and '2. Defining the Problem'.
-
5.3. Work Visualization and Kanban Process Innovation
-
David J. Anderson, "Kanban: Successful Evolutionary Change for Your Technology Business" (Insight, 2014)
-
Reference context: This provides a practical foundation for Kanban architecture that dramatically reduces management resources by excluding artificial workflow controls or rule enforcement proposed in '3. The Problem-Solving Process', and by visualizing data in multiple dimensions (Engineer/PM/Client View) for sharing.
-
dev.young