
1. Reasons Why Observability Needs to Be Lightweight
In modern cloud and Kubernetes-based infrastructure environments, Observability has become a key element of system operations.
As the scale of the service increases, the ability to observe the system's state and quickly analyze problems based on logs, metrics, and tracing becomes very important.
Especially in MSA (Microservice Architecture) based structures, where numerous services operate in a distributed manner, it is difficult to identify the cause of failures with just simple application logs.
For this reason, the combination of Loki + Promtail + Prometheus + Grafana is used as a representative Observability stack in many environments.
This combination has a well-established open-source ecosystem and excellent integration with Kubernetes environments, making it often used as a de facto standard stack.
However, in actual operational environments, there were several limitations to these traditional configurations.
The biggest issue was resource usage. Promtail and node-exporter operate as separate DaemonSets, and individual Pods are created for each node.
As the number of nodes increases, the number of agent Pods will also increase.
In addition, since Prometheus uses a memory-based TSDB (Time Series Database), the memory usage also tends to increase rapidly as the amount of metric collection increases.
This structure has been a significant burden, especially in small Kubernetes clusters or Edge environments.
For example, in environments like the following, the existing Observability stack could require excessive resources.
-
Single Node Kubernetes Cluster
-
ARM-based Edge Device
-
Industrial IoT Gateway
-
Development environment where cost optimization is important
-
Small on-premises environment
In the project, we had to operate the Observability configuration in an environment with limited actual resources, and there was a problem that the CPU and memory usage was excessively high with the existing stack structure.
In particular, the metric repository and log repository were operating separately, which increased operational complexity as well.
Ultimately, there was a need for a much lighter and more efficient structure while maintaining compatibility with the existing stack as much as possible.
To address this, we reviewed a lightweight configuration based on Grafana Alloy + VictoriaLogs + VictoriaMetrics and applied it to the actual operational environment.
2. Existing Observability stack structure and limitations
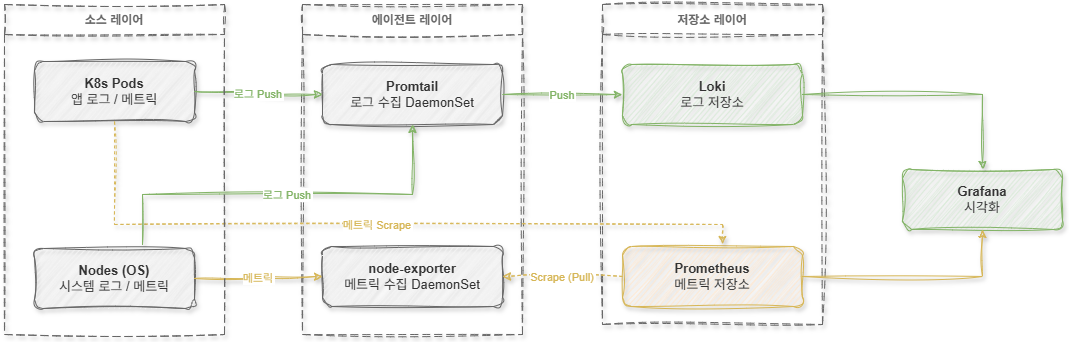
The existing observability stack consisted of a structure of Loki + Promtail + Prometheus + Grafana. In this structure, log and metric collection operates independently.
First, log collection is handled by Promtail. Promtail reads container log files from Kubernetes nodes and pushes them to Loki.
On the other hand, metric collection is configured with a combination of node-exporter and Prometheus. The node-exporter exposes OS metrics such as CPU, memory, disk, and network status, and Prometheus periodically collects this data using a pull mechanism.
In other words, the log and metric collection structures were completely separate.
[ Flowchart (Legacy Stack) ]
This structure was a sufficiently stable and proven method, but several issues arose during the actual operation process.
The first was the issue of increasing the number of agents.
Since Promtail and node-exporter operate as separate DaemonSets, at least two Observability Pods were running per node.
In environments with a small number of nodes, the resource ratio occupied by the Observability Pod itself could become relatively very high.
The second issue was related to memory usage.
Prometheus stores metric data in a memory-based TSDB.
As the amount of metric collection increases, memory usage also tends to increase almost linearly. In real operational environments, we have observed that as the number of metrics increases, the memory usage of Prometheus increases rapidly.
The third was the increase in operational complexity.
Since Promtail, node-exporter, and Prometheus each have different configuration file structures, operators had to manage multiple configuration structures simultaneously.
Additionally, the upgrade and version compatibility management of each component had to be carried out separately.
In particular, in the Edge environment, storage disk usage was also an important issue. Due to the characteristics of the indexing and compression structure, Loki could experience a rapid increase in disk usage as the volume of logs increased.
Ultimately, the project has resulted in the design of a lightweight structure with the following objectives.
-
Single agent-based structure
-
Minimizing Memory Usage
-
Improving Log Storage Efficiency
-
Reusable existing Grafana dashboards
-
Maintain compatibility with Prometheus and Loki ecosystem
-
Reduction of operational complexity
3. Integrated collection structure based on Grafana Alloy
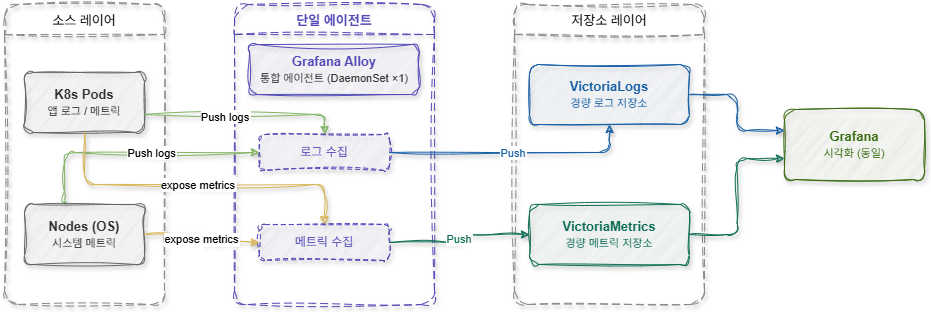
The key to the lightweight configuration was integrating the collection agent with Grafana Alloy.
Grafana Alloy is an integrated Observability Agent based on OpenTelemetry, providing a structure that can collect logs and metrics simultaneously. In the previous structure, Promtail and node-exporter operated separately, but Grafana Alloy could perform both roles with just one agent.
In other words, it has become possible to consolidate the existing two DaemonSets into one. This structure provided advantages beyond merely reducing the number of Pods.
The biggest advantage was resource efficiency.
In the past, each agent operated as an independent process, using CPU and memory separately, but in the Alloy-based architecture, log and metric collection are performed simultaneously within a single process. As a result, the memory usage per agent per node has been significantly reduced.
Additionally, configuration management has also become much simpler. Previously, Promtail configuration and Prometheus Scrape configuration had to be managed separately, but in Alloy, everything can be managed based on a single configuration file. This has greatly reduced operational complexity. The project has deployed Alloy as a DaemonSet in the Kubernetes environment.
Alloy is designed to perform the following roles simultaneously.
-
Kubernetes log collection
-
Node metrics collection
-
Container metrics collection
-
Kubernetes Service Discovery
-
Log labeling
-
Metric Labeling
[ Lightweight Stack (Lightweight Stack) ]
In particular, since it is based on OpenTelemetry architecture, the ability to extend to Tracing in the future was a significant advantage.
However, this project focused only on the lightweight implementation of Logging and Metrics, and Tracing was excluded from the scope.
As a result, the introduction of Grafana Alloy significantly simplified the agent structure, and we also achieved improved operational stability.
4. Introduction of VictoriaLogs and VictoriaMetrics
The next step after integrating the collection agent was the lightweight storage optimization.
The project replaced the existing Loki and Prometheus with VictoriaLogs and VictoriaMetrics, respectively. VictoriaMetrics is a Prometheus-compatible TSDB characterized by very high compression rates and low memory usage.
In particular, there is the advantage that the memory usage is much lower compared to Prometheus based on the same metric collection amount.
In actual test environments, it was confirmed that VictoriaMetrics reduces memory usage by about 7 times compared to the existing Prometheus.
Additionally, it fully supports PromQL, allowing most existing Grafana dashboards to be used without modification.
This was a significant advantage during the transition to the production environment. If the query language or API structure had been completely different, it would have required rewriting all existing dashboards and alert configurations.
On the other hand, VictoriaMetrics offered high compatibility with the Prometheus API, making the migration burden very light. The log storage also used VictoriaLogs instead of Loki. VictoriaLogs is designed as a highly compressed log storage solution and provides high compatibility with the Loki API.
In particular, the disk usage reduction effect was outstanding. In the test environment, we observed cases where disk usage decreased by up to 30 times compared to the existing Loki. This provided significant cost savings in environments where long-term log storage is required.
The search speed also worked very quickly. In the project, we performed search performance tests based on actual operational log data and were able to confirm a much more stable response speed compared to the existing Loki.
As a result, the combination of VictoriaLogs and VictoriaMetrics proved to be a very effective choice not only for simple lightweighting but also for operational efficiency and cost savings.
5. Comparison of Existing Configuration and Lightweight Configuration
The biggest difference between the existing configuration and the lightweight configuration was structural simplification and resource efficiency.
|
Classification |
Existing configuration |
Lightweight Configuration |
|---|---|---|
|
Log Agent |
Promtail (DaemonSet) |
Grafana Alloy |
|
Metric Agent |
node-exporter (DaemonSet) |
Grafana Alloy |
|
Agent Count |
2 DaemonSets |
1 DaemonSet |
|
Agent memory (per node) |
~120 MB (60+60) |
~60 MB |
|
Log storage |
Loki |
VictoriaLogs |
|
Metric Repository |
Prometheus |
VictoriaMetrics |
|
Storage Memory (Total) |
~2 GB+ |
~800 MB |
|
Configuration file |
Managed separately in 2 parts |
1 unified management |
* VictoriaMetrics uses about 7 times less memory compared to Prometheus, and VictoriaLogs can reduce disk usage by up to 30 times compared to Loki.
In the existing structure, the following components operated independently of each other.
-
Promtail
-
node-exporter
-
Prometheus
-
Loki
-
Grafana
In contrast, the lightweight structure has been simplified as follows.
-
Grafana Alloy
-
VictoriaLogs
-
VictoriaMetrics
-
Grafana
The most noticeable change was the reduction in the number of agents. Previously, two DaemonSets were required for log and metric collection, but in the streamlined configuration, it could be integrated with just one Grafana Alloy.
As a result, memory usage per node has also significantly reduced.
In the previous structure, the agent's memory usage was around 120MB, but in the Alloy-based structure, it has decreased to about 60MB. The difference in storage memory usage was even greater.
In the combination of Prometheus and Loki, the total memory usage was around 2GB or more, but it decreased to about 800MB in the Victoria series storage-based architecture.
This made a significant difference in single-node clusters or edge environments.
Additionally, there were advantages from an operational perspective. Previously, it was necessary to manage multiple configuration files and versioning separately, but in the lightweight structure, the management points were significantly reduced. Since Grafana was maintained the same as before, most of the dashboards and alert rules could be reused as they were.
In other words, users could retain their existing operational experience while only lightweighting the internal observability structure.
As a result, this lightweighting effort had significance beyond mere resource savings. It was a very meaningful project in that we built a sustainable structure that can maintain observability reliably even in a limited resource environment.
6. Conclusion
Observability has become a necessity rather than a choice in modern infrastructure environments. However, not all environments have resources at the level of large-scale cloud infrastructure.
Especially in small Kubernetes clusters or Edge environments, it is necessary to build a stable operational structure within limited CPU and memory.
In this project, we were able to transform the existing Observability stack into a much lighter and more efficient structure using the combination of Grafana Alloy + VictoriaLogs + VictoriaMetrics.
In particular, we could feel the following advantages.
-
Simplification of agent structure
-
Reduction of memory usage
-
Reduce disk usage
-
Simplify configuration management
-
Reuse existing Grafana environment
-
Maintain high compatibility
The most important point was that we were able to significantly reduce operating costs while maintaining compatibility with the existing Prometheus and Loki ecosystem.
This means more than just cost reduction. It was a strategic choice in terms of being able to build a more stable and sustainable operating environment within limited resources. We expect that in the future, it will be entirely possible to expand to a complete OpenTelemetry-based architecture, including tracing.
Through this experience, I was once again able to confirm that Observability is not just about collecting a lot of data, but it's much more important to design an efficient structure that fits the operational environment.
[References]
Sean