
1. Overview
This project required the introduction of a feature that detects anomalies in ship sensor data and generates alarms. To implement this, a new batch logic was developed to query sensor data for each ship, detect conditions for alarm generation, and then generate alarms.
This was executed in a service deployed in Pod form on the Kubernetes cluster of the development environment, and it was expected to run once a day to accumulate alarm generation statistics for each ship. However, contrary to expectations, there was a recurring problem of Pods restarting during the execution of the logic.
2. Problem Situation
When checking the cause of the Pod restarting every time the logic was executed, it was found to be OOMKilled (Out Of Memory Killed), meaning that the container was forcibly terminated by the OOM Killer due to exceeding the memory limit. I wondered if the Memory Limit setting was too small to handle the large volume of ship data, so I tried increasing the Pod's Memory Limit, but the problem still wasn't resolved.
Ultimately, while OOMKilled was clearly the cause of the Pod restarting, it was not directly related to the Limit setting. If the Memory Limit was not insufficient, why was the Pod forcibly terminated due to OOMKilled?
3. JVM Memory: Heap and Non-Heap
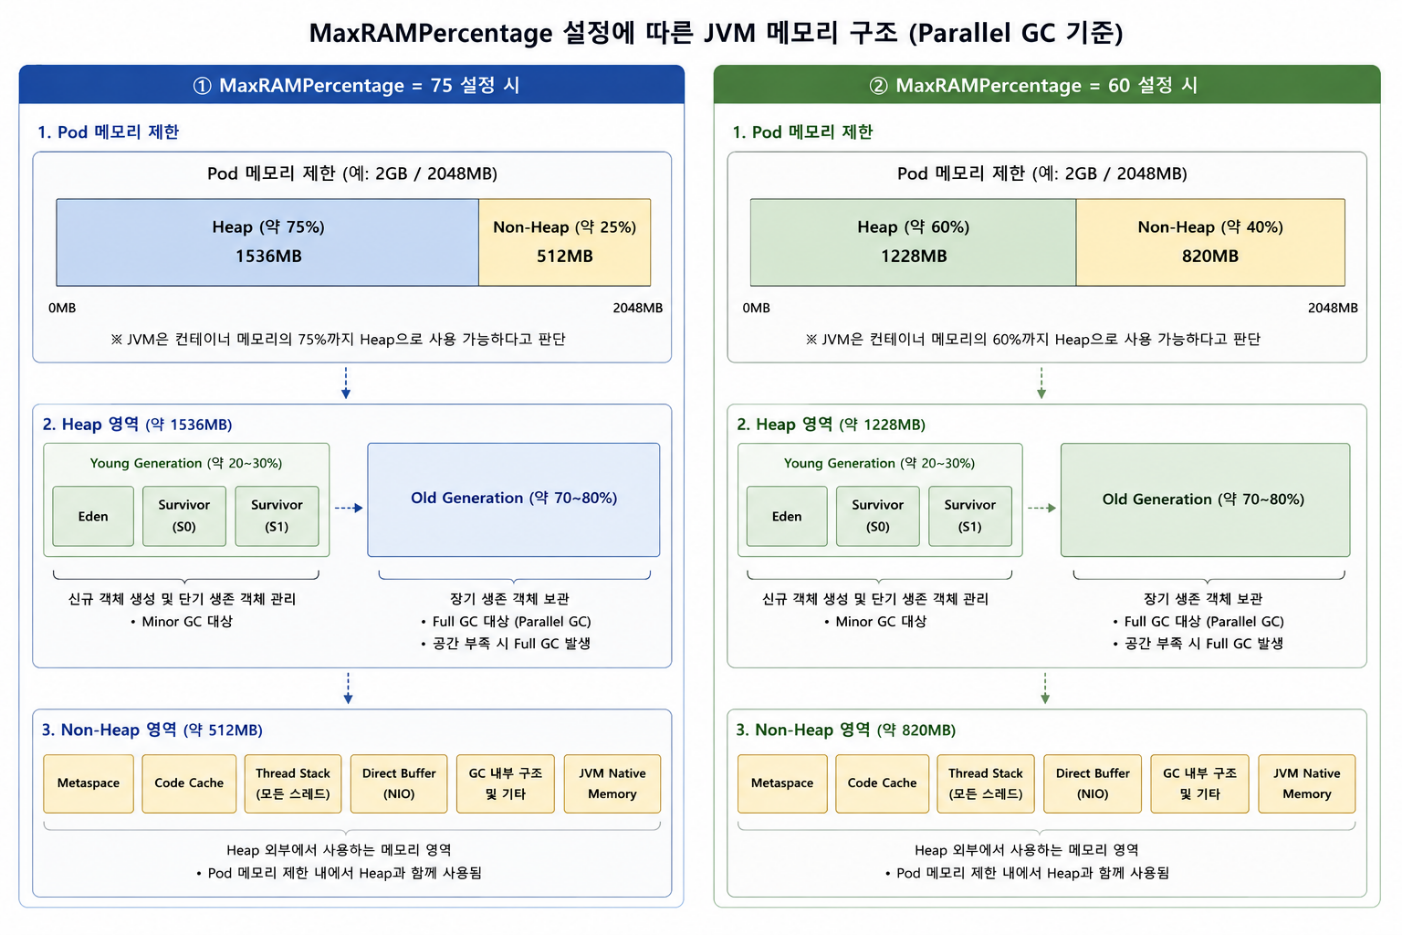
JVM memory can be broadly divided into Heap and Non-Heap areas.
3.1 Heap Area
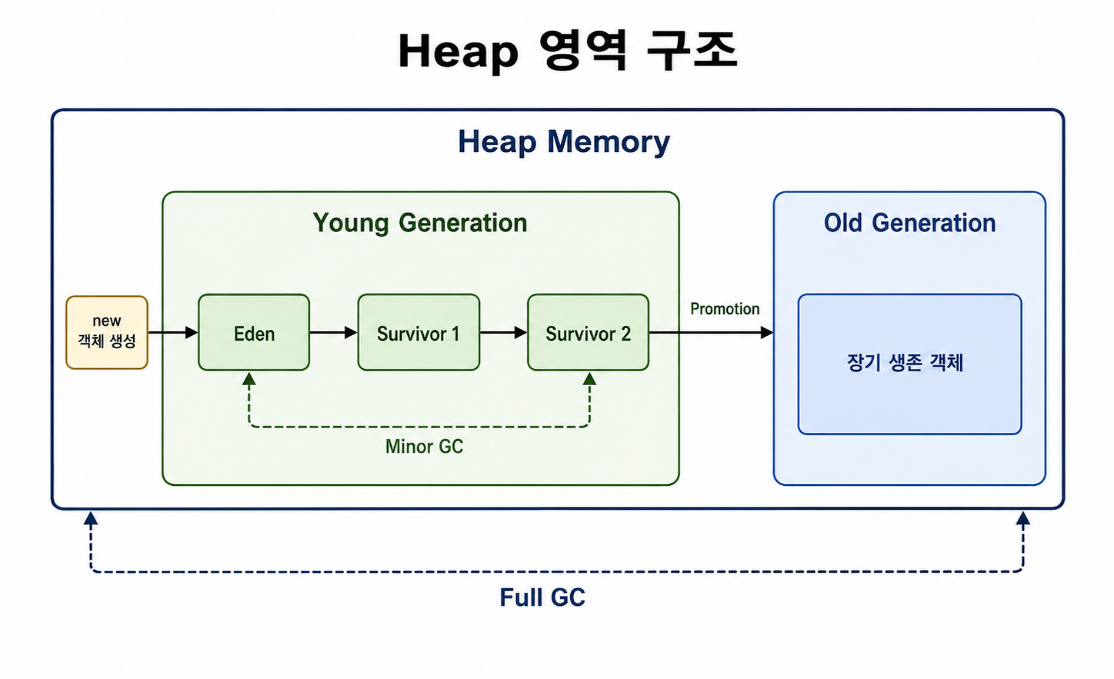
This is the area where Java objects are stored, and when objects are created with the new keyword in Java applications, they are mostly stored in the Heap area. This is the main management target for GC (Garbage Collector), and objects that are no longer referenced are cleaned up by the GC.
Heap is also further divided into Young Generation and Old Generation.
1) Young Generation
This is the area where newly created objects are first stored. Most objects are used up shortly after they are created. For example, temporary DTOs, strings, collections created during request processing fall under this category.
The Young Generation can be divided into Eden and Survivor areas, where objects are usually first created in the Eden area. When the Eden area is full, a Minor GC occurs, and objects that survive after the Minor GC are moved to the Survivor area.
Objects that continue to survive after several Minor GCs are considered long-lived objects and are moved to the Old Generation, a process known as Promotion.
2) Old Generation
This is the area where long-lived objects are stored. Spring Beans, cache data, and objects that have passed through several Minor GCs may remain in the Old Generation.
If this area runs out of space, a Full GC or Major GC may occur. Full GC is heavier than Minor GC because it broadly inspects both Young Generation and Old Generation, and the Stop-The-World time during which the application is paused may be longer.
3.2 Non-Heap Area
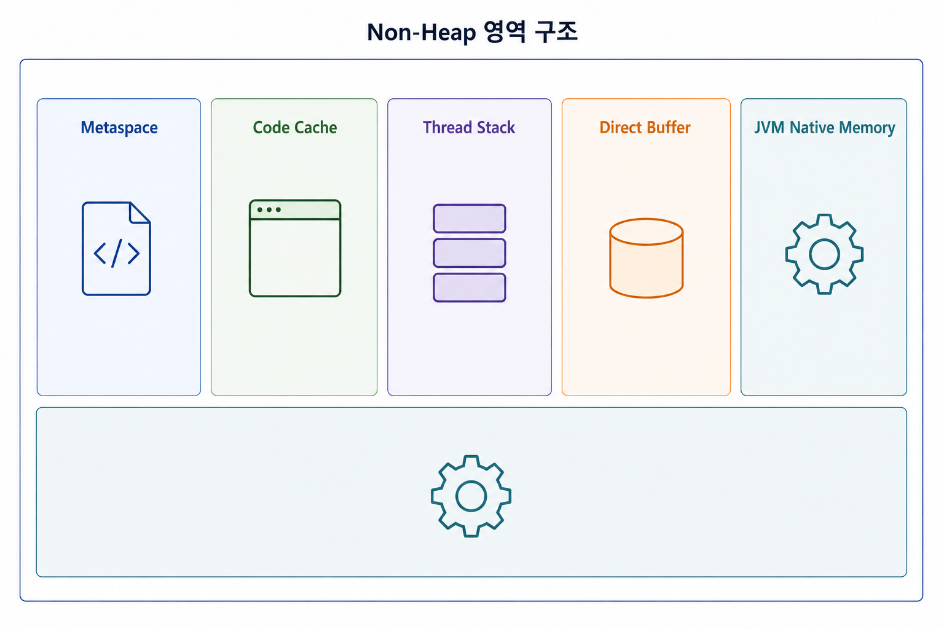
This is the JVM memory area outside of the Heap where Java objects are stored. Although this area is not a general object storage space that is primarily targeted by GC, it is memory that the JVM must use to run Java applications. Metaspace, Code Cache, Thread Stack, and JVM Native Memory belong to the Non-Heap area.
4. Relationship between Heap Size and GC
The Heap Size of the JVM is closely related to the behavior of GC. Most objects created in the application are stored in the Heap, and GC collects objects that are no longer referenced within this Heap area to reclaim memory. Therefore, the timing, frequency, and execution duration of GC can vary depending on how the Heap Size is set.
4.1 When Heap Size is set small
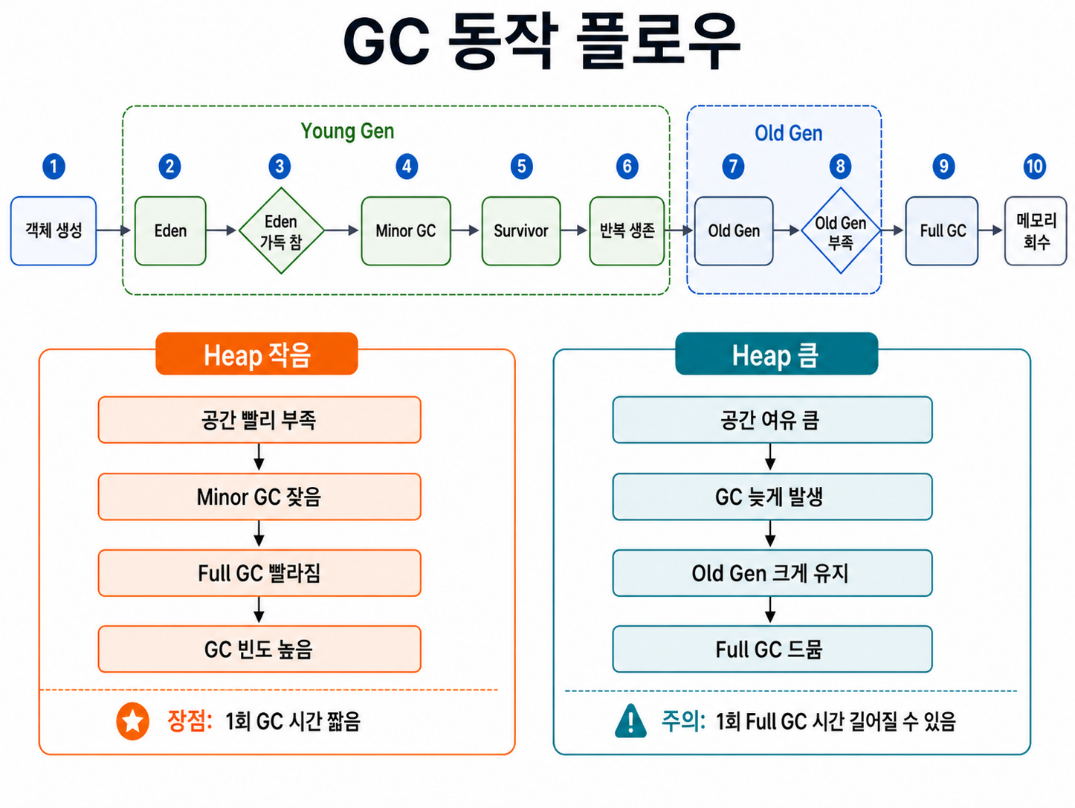
If the Heap Size is set small, the available space for storing objects quickly runs out and the JVM performs GC more frequently. In particular, if the Eden area of the Young Generation fills up quickly, Minor GCs occur more often, and if the free space in the Old Generation becomes scarce, Full GC may occur. While a small Heap can lead to frequent GCs, the range of memory that needs to be checked and cleaned up in a single GC is relatively small, which may result in shorter GC execution times.
4.2 When Heap Size is set large
Conversely, if the Heap Size is set large, it can store more objects, leading to a lower frequency of GC occurrences. Especially if the Old Generation area enlarges, it can take longer to reach a state of insufficient space even with many long-lived objects accumulated, which may result in Full GC happening less frequently. Moreover, if Full GC occurs when the Heap is large, the range of memory to be cleaned up is larger, potentially leading to longer durations for a single Full GC. Additionally, even if Parallel GC, which can handle multiple GC Threads in parallel, is used, Stop-The-World may occur during Full GC where application Threads are halted.
While setting the Heap large may reduce the frequency of Full GC occurrences, unnecessary objects may remain in the Heap for too long during the delay of GC. Additionally, when Full GC occurs, it must clean up a larger memory area, leading to longer GC times. Conversely, setting the Heap too small can lead to excessive GC occurrences, degrading application processing performance. Therefore, neither setting the Heap Size too large nor too small is optimal, and it is necessary to adjust it appropriately according to the application's situation.
5. Problem JVM Execution Options of Pod
The Memory Limit of the Pod was 2GB and the JVM execution option was set to -XX:MaxRAMPercentage=75, which sets the maximum ratio of Heap to 75% of the container memory. Simple calculations show that the Heap could grow to approximately 1.5GB, which is 75% of 2GB, and around 0.5GB could be used for Non-Heap and Native areas. In a Kubernetes environment, this is a relatively high level of Heap ratio, and as the Heap area was set larger than necessary, a relatively large Old Generation area was also secured, resulting in a suspicion that the frequency of Full GC occurring decreased and OOMKilled did not happen.
Therefore, after lowering it to -XX:MaxRAMPercentage=60 and executing the batch logic and monitoring the Pod status, it was confirmed that the logic was performed normally without restarting the Pod. When checking the maximum memory available for JVM, the available memory among allocated memory, and the actual memory in use through application logs, it was confirmed that Full GC was operating normally, unlike before. When the option was -XX:MaxRAMPercentage=75, there was an occurrence where the Pod restarted without GC happening when the memory in use during logic execution reached the maximum memory, but after lowering it to -XX:MaxRAMPercentage=60 and checking the application logs, it was observed that Full GC was executed when the memory in use reached the maximum memory, significantly reducing the memory in use.
6. Conclusion
Through this case, I realized that simply setting the Memory Limit is not enough to solve the OOMKilled issue of Kubernetes Pods. Of course, setting an appropriate Memory Limit is more important, but I also learned that the JVM Heap Size configuration must be considered as well.
Therefore, when operating Java applications in a Kubernetes environment and facing the OOMKilled issue, we should not just increase the Memory Limit blindly but should check if the Heap Size and Non-Heap areas are properly configured and if GC is functioning correctly. This will help reduce unnecessary resource waste and create a more stable and efficient application operating environment.
deeenee